Note
Go to the end to download the full example code. or to run this example in your browser via Binder
Introduction#
In this section, we will briefly explain what is functional data analysis (FDA), and we will introduce scikit-fda, a library that provides FDA tools to staticians, engineers or machine learning practicioners in the Python scientific ecosystem.
# Author: Carlos Ramos Carreño
# License: MIT
What is functional data analysis?#
Traditional multivariate statistics focus on the simultaneous analysis of a finite number of variables. In this setting, we have several observations, each of them consisting on a vector of measured values. The variables, or coordinates of this vector, could be correlated, but otherwise they can be arbitrarily ordered inside the observed vector, provided that the order is the same for each observation. Usually these observations are considered to be instances of a random vector, and a big part of the analysis is centered in finding the distribution associated with it.
In contrast, in functional data analysis each observation is a function of one or several variables, such as curves or surfaces. These functions are usually continuous and often they are smooth, and derivatives can be computed. The number of variables of these objects is then infinite, as each evaluation of the function at one point could be considered as one variable. Moreover, now it is not possible to reorder the variables of the observations without altering substantially its structure. If the functions are continuous, nearby variables are highly correlated, a characteristic that makes some classical multivariate methods unsuitable to work with this data.
In this setting, observations can also be considered to be instances of a “functional random variable”, usually called a stochastic process or a random field. However, some of the concepts that proved very useful to analyze multivariate data, such as density functions, are not applicable to functional data, while new tools, such as taking derivatives, become available.
As such, functional data can benefit of a separate analysis from multivariate statistics, but also adapting and extending multivariate techniques when possible.
What is scikit-fda?#
scikit-fda is a Python library containing classes and functions that allow you to perform functional data analysis tasks. Using it you can:
Represent functions as Python objects, both in a discretized fashion and as a basis expansion.
Apply preprocessing methods to functional data, including smoothing, registration and dimensionality reduction.
Perform a complete exploratory analysis of the data, summarizing its main properties, detecting possible outliers and visualizing the data in several ways.
Apply statistical inference tools developed for functional data, such as functional ANOVA.
Perform usual machine learning tasks, such as classification, regression or clustering, using functional observations.
Combine the tools offered by scikit-fda with other tools of the Python scientific ecosystem, such as those provided by the popular machine learning library scikit-learn.
Anatomy of a function#
We would like to briefly remind the reader the basic concepts that are employed to talk about functions. Functions in math are a relation between two sets, the domain and the codomain in which each element of the domain is restricted to be related to exactly one element of the codomain. The intuition behind this is that a function represents some type of deterministic process, that takes elements of the domain as inputs and produces elements of the codomain as outputs.
In FDA, the inputs or parameters of a function are assumed to be continuous parameters, and so are the outputs, or values of the function. Thus, it is usual to restrict our functional observations to be functions \(\{x_i: \mathcal{T} \subseteq \mathbb{R}^p \to \mathbb{R}^q\}_{i=1}^N\). In this case both the domain and codomain are (subsets of) vector spaces of real numbers, and one could talk of the dimension of each of them as a vector space (in this case the domain dimension is \(p\) and the codomain dimension is \(q\)).
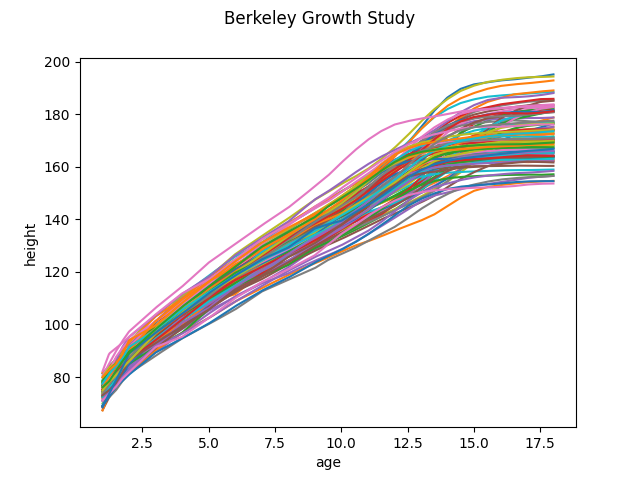
The most common case of functional observation, and the one that has received more attention in the functional data literature, is the case of functions \(\{x_i: \mathcal{T} \subseteq \mathbb{R} \to \mathbb{R}\}_{i=1}^N\) (curves or trajectories).
As an example, the following code shows the Berkeley Growth dataset, one of the classical datasets used in FDA. The curves are heights of 93 boys and girls measured at several points since their birth to their 18th birthday. Here the domain \(\mathcal{T}\) is the interval \([0, 18]\) and both the domain and codomain have a dimension of one.
import matplotlib.pyplot as plt

import skfda

X, y = skfda.datasets.fetch_growth(return_X_y=True)

X.plot()
plt.show()
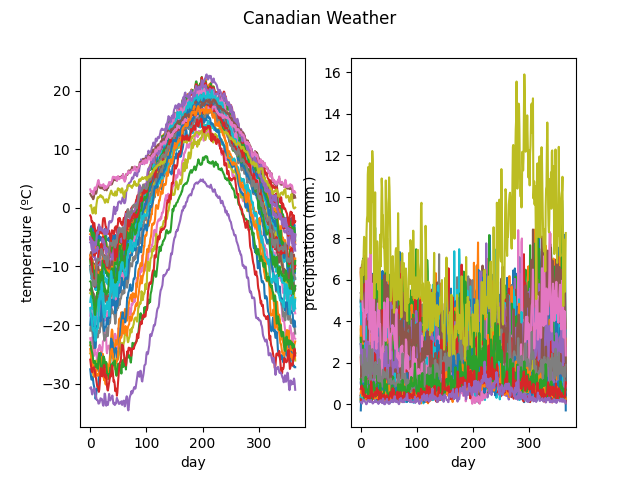
Functions where the domain dimension is greater than one ( such as surfaces or higher dimensional objects) are referred to as functions of several variables. Functions where the codomain dimension is greater than one are called vector-valued functions.
As an example we show another popular dataset: Canadian Weather. Here each observation correspond to data taken from a different weather station in Canada. For each day of the year we have two values: the average temperature at that day among several years and the average precipitation among the same years. Thus, here the domain \(\mathcal{T}\) is the interval \([0, 365)\), the domain dimension is one and the codomain dimension is two. We can see that by default each coordinate of the values of the function is plotted as a separate coordinate function.
X, y = skfda.datasets.fetch_weather(return_X_y=True)

X.plot()
plt.show()
Total running time of the script: (0 minutes 0.257 seconds)