Note
Go to the end to download the full example code. or to run this example in your browser via Binder
Creating a new interpolation or extrapolation strategy#
Shows how to add new interpolation and extrapolation strategies.
# Author: Carlos Ramos Carreño
# License: MIT
In this example, we want to showcase how it is possible to make new interpolation and extrapolation strategies. These are Python callables with the following prototype:
def evaluator_prototype(fdata, eval_points, *, aligned):
    """Prototype of a extrapolation/interpolation strategy."""
Here, fdata is a FData object,
èval_points is a NumPy array with the points at which this object
will be evaluated, and aligned is a boolean parameter indicating if
the points are common for all samples or different for each.
For example, lets consider for illustration purposes only an
interpolation/extrapolation strategy that uses the
Lagrange polynomial
between the points of a FDataGrid.
This is in general a bad idea, as when the number of points is high this
polynomial has rapid oscillations between the measured points.
Moreover, the implementation here is not vectorized and has low performance.
import numpy as np
from scipy.interpolate import lagrange


def evaluator_lagrange(fdata, eval_points, *, aligned):
    """Lagrange interpolation, for 1D FDataGrid only."""
    grid_points = fdata.grid_points[0]
    result = []

    for i, data in enumerate(fdata.data_matrix):
        polynomial = lagrange(grid_points, data)

        if aligned:
            # Same points for all observations.
            # The dimension is n_points x dim_domain (1 in this case).
            result.append(polynomial(eval_points))
        else:
            # Different points for every observation.
            # The dimension is n_samples x n_points x dim_domain.
            result.append(polynomial(eval_points[i]))

    return np.array(result)
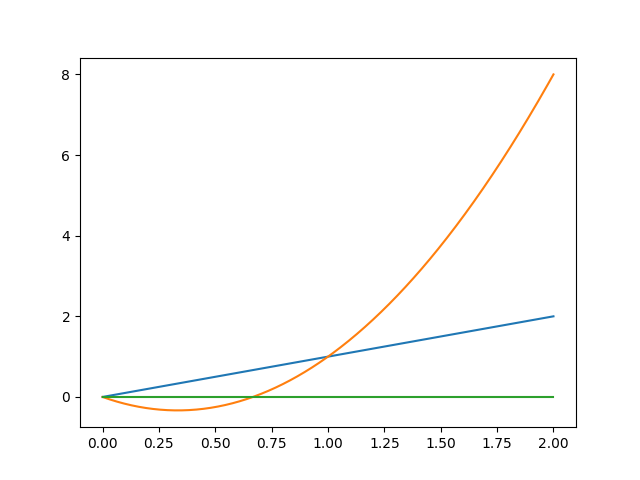
We can now create a new FDataGrid and
plot it. Note that the plot uses the specified interpolation between the
measured points.
Note also that is not necessary to specify the extrapolation, as by
default for FDataGrid it already calls
the interpolation if no extrapolation is defined.
We can try to evaluate the function at different points, including some between measurements or outside the original range, to test the interpolation and extrapolation.
X([-1, 0, 0.5, 1, 2, 3])
array([[[-1.  ],
        [ 0.  ],
        [ 0.5 ],
        [ 1.  ],
        [ 2.  ],
        [ 3.  ]],

       [[ 5.  ],
        [ 0.  ],
        [-0.25],
        [ 1.  ],
        [ 8.  ],
        [21.  ]],

       [[ 0.  ],
        [ 0.  ],
        [ 0.  ],
        [ 0.  ],
        [ 0.  ],
        [ 0.  ]]])
We can also try to evaluate each observation at different points to test this behavior.
X([[-1, 0], [0.5, 1], [2, 3]], aligned=False)
array([[[-1.  ],
        [ 0.  ]],

       [[-0.25],
        [ 1.  ]],

       [[ 0.  ],
        [ 0.  ]]])
Total running time of the script: (0 minutes 0.048 seconds)