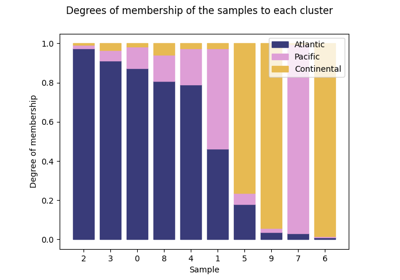
ClusterMembershipPlot#
- class skfda.exploratory.visualization.clustering.ClusterMembershipPlot(estimator, fdata, chart=None, *, fig=None, axes=None, sort=-1, sample_labels=None, cluster_colors=None, cluster_labels=None, colormap=None, x_label=None, y_label=None, title=None)[source]#
Class ClusterMembershipPlot.
- Parameters:
estimator (FuzzyClusteringEstimator) – estimator used to calculate the clusters.
X – contains the samples which are grouped into different clusters.
fig (Figure | None) – figure over which the graph is plotted in case ax is not specified. If None and ax is also None, the figure is initialized.
axes (Axes | Sequence[Axes] | None) – axis over where the graph is plotted. If None, see param fig.
sample_colors – contains in order the colors of each sample of the fdatagrid.
sample_labels (Sequence[str] | None) – contains in order the labels of each sample of the fdatagrid.
cluster_labels (Sequence[str] | None) – contains in order the names of each cluster the samples of the fdatagrid are classified into.
colormap (matplotlib.colors.Colormap) – colormap from which the colors of the plot are taken.
x_label (str | None) – Label for the x-axis. Defaults to “Cluster”.
y_label (str | None) – Label for the y-axis. Defaults to “Degree of membership”.
title (str | None) – Title for the figure where the clustering results are ploted. Defaults to “Degrees of membership of the samples to each cluster”.
fdata (FData)
chart (Figure | Axes | None)
sort (int)
cluster_colors (Sequence[ColorLike] | None)
Methods
- hover(event)[source]#
Activate the annotation when hovering a point.
Callback method that activates the annotation when hovering a specific point in a graph. The annotation is a description of the point containing its coordinates.
- Parameters:
event (MouseEvent) – event object containing the artist of the point hovered.
- Return type:
None