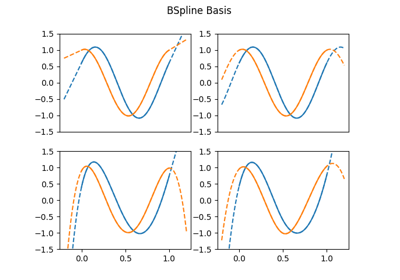
BSplineBasis#
- class skfda.representation.basis.BSplineBasis(domain_range=None, n_basis=None, order=4, knots=None)[source]#
BSpline basis.
BSpline basis elements are defined recursively as:
\[B_{i, 1}(x) = 1 \quad \text{if } t_i \le x < t_{i+1}, \quad 0 \text{ otherwise}\]\[B_{i, k}(x) = \frac{x - t_i}{t_{i+k} - t_i} B_{i, k-1}(x) + \frac{t_{i+k+1} - x}{t_{i+k+1} - t_{i+1}} B_{i+1, k-1}(x)\]Where k indicates the order of the spline.
Implementation details: In order to allow a discontinuous behaviour at the boundaries of the domain it is necessary to place m knots at the boundaries, as done in Ramsay and Silverman (chapter 3)[1]. This is automatically done so that the user only has to specify a single knot at the boundaries.
- Parameters:
domain_range (DomainRangeLike | None) – A tuple of length 2 containing the initial and end values of the interval over which the basis can be evaluated.
n_basis (int | None) – Number of functions in the basis.
order (int) – Order of the splines. One greather than their degree.
knots (Sequence[float] | None) – List of knots of the spline functions.
Examples
Constructs specifying number of basis and order.
>>> bss = BSplineBasis(n_basis=8, order=4)
If no order is specified defaults to 4 because cubic splines are the most used. So the previous example is the same as:
>>> bss = BSplineBasis(n_basis=8)
It is also possible to create a BSpline basis specifying the knots.
>>> bss = BSplineBasis(knots=[0, 0.2, 0.4, 0.6, 0.8, 1])
Once we create a basis we can evaluate each of its functions at a set of points.
>>> bss = BSplineBasis(n_basis=3, order=3)
>>> bss([0, 0.5, 1])
array([[[ 1.  ],
        [ 0.25],
        [ 0.  ]],
       [[ 0.  ],
        [ 0.5 ],
        [ 0.  ]],
       [[ 0.  ],
        [ 0.25],
        [ 1.  ]]])
And evaluates first derivative
>>> deriv = bss.derivative()
>>> deriv([0, 0.5, 1])
array([[[-2.],
        [-1.],
        [ 0.]],
       [[ 2.],
        [ 0.],
        [-2.]],
       [[ 0.],
        [ 1.],
        [ 2.]]])
References
Methods
coordinate_basis_and_coefs(coefs, key)Return a fdatabasis for the coordinate functions indexed by key.
copy([domain_range])Basis copy.
derivative(*[, order])Construct a FDataBasis object containing the derivative.
derivative_basis_and_coefs(coefs[, order])Return basis and coefficients of the derivative.
evaluate(eval_points, *[, derivative])Evaluate Basis objects and its derivatives.
Return the Gram Matrix of a basis.
inner_product_matrix([other])Return the Inner Product Matrix of a pair of basis.
Return wether the domain range has been set explicitly.
plot(*args, **kwargs)Plot the basis object or its derivatives.
rescale([domain_range])Return a copy of the basis with a new domain range.
to_basis()Convert the Basis to FDatabasis.
- coordinate_basis_and_coefs(coefs, key)[source]#
Return a fdatabasis for the coordinate functions indexed by key.
- derivative(*, order=1)[source]#
Construct a FDataBasis object containing the derivative.
- Parameters:
order (int) – Order of the derivative. Defaults to 1.
- Returns:
Derivative object.
- Return type:
- derivative_basis_and_coefs(coefs, order=1)[source]#
Return basis and coefficients of the derivative.
- evaluate(eval_points, *, derivative=0)[source]#
Evaluate Basis objects and its derivatives.
Evaluates the basis functions at a list of given values.
Deprecated since version 0.8: Use normal calling notation instead.
- Parameters:
eval_points (ArrayLike) – List of points where the basis is evaluated.
derivative (int) –
order of the derivative.
Deprecated since version 0.4: Use derivative method instead.
- Returns:
Matrix whose rows are the values of the each basis function or its derivatives at the values specified in eval_points.
- Return type:
- gram_matrix()[source]#
Return the Gram Matrix of a basis.
The Gram Matrix is defined as
\[G_{ij} = \langle\phi_i, \phi_j\rangle\]where \(\phi_i\) is the ith element of the basis. This is a symmetric matrix and positive-semidefinite.
- inner_product_matrix(other=None)[source]#
Return the Inner Product Matrix of a pair of basis.
The Inner Product Matrix is defined as
\[I_{ij} = \langle\phi_i, \theta_j\rangle\]where \(\phi_i\) is the ith element of the basis and \(\theta_j\) is the jth element of the second basis. This matrix helps on the calculation of the inner product between objects on two basis and for the change of basis.
- is_domain_range_fixed()[source]#
Return wether the domain range has been set explicitly.
This is useful when using a basis for converting a dataset, since if this is not explicitly assigned it can be changed to the domain of the data.
- Returns:
True if the domain range has been fixed. False otherwise.
- Return type:
Examples using skfda.representation.basis.BSplineBasis#
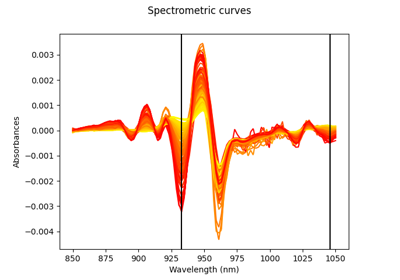
Spectrometric data: derivatives, regression, and variable selection