FPCAPlot#
- class skfda.exploratory.visualization.FPCAPlot(mean, components, *, factor=1, multiple=None, chart=None, fig=None, axes=None, n_rows=None, n_cols=None)[source]#
FPCAPlot visualization.
- Parameters:
mean (FData) – The functional data object containing the mean function. If len(mean) > 1, the mean is computed.
components (FData) – The principal components
factor (float) – Multiple of the principal component curve to be added or subtracted.
fig (Figure | None) – Figure over which the graph is plotted. If not specified it will be initialized
axes (Axes | None) – Axes over where the graph is plotted. If
None, see param fig.n_rows (int | None) – Designates the number of rows of the figure.
n_cols (int | None) – Designates the number of columns of the figure.
multiple (float | None)
chart (Figure | Axes | None)
Methods
- hover(event)[source]#
Activate the annotation when hovering a point.
Callback method that activates the annotation when hovering a specific point in a graph. The annotation is a description of the point containing its coordinates.
- Parameters:
event (MouseEvent) – event object containing the artist of the point hovered.
- Return type:
None
Examples using skfda.exploratory.visualization.FPCAPlot#
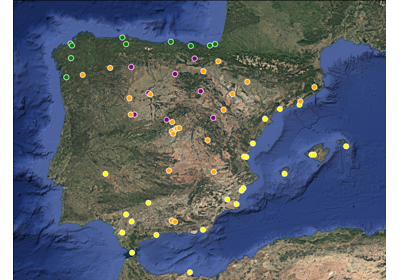
Meteorological data: data visualization, clustering, and functional PCA