IntegratedDepth#
- class skfda.exploratory.depth.IntegratedDepth(*, multivariate_depth=None)[source]#
Functional depth as the integral of a multivariate depth.
- Parameters:
multivariate_depth (Depth) –
Multivariate depth to integrate. By default it is the one used by Fraiman and Muniz, that is,
\[D(x) = 1 - \left\lvert \frac{1}{2}- F(x)\right\rvert\]
Examples
>>> import skfda
>>>
>>> data_matrix = [[1, 1, 2, 3, 2.5, 2],
...                [0.5, 0.5, 1, 2, 1.5, 1],
...                [-1, -1, -0.5, 1, 1, 0.5],
...                [-0.5, -0.5, -0.5, -1, -1, -1]]
>>> grid_points = [0, 2, 4, 6, 8, 10]
>>> X = skfda.FDataGrid(data_matrix, grid_points)
>>> depth = skfda.exploratory.depth.IntegratedDepth()
>>> depth(X).round(1)
array([ 0.5,  0.8,  0.9,  0.9])
References
Fraiman, R., & Muniz, G. (2001). Trimmed means for functional data. Test, 10(2), 419–440. https://doi.org/10.1007/BF02595706
Methods
fit(X[, y])Learn the distribution from the observations.
fit_transform(X[, y])Compute the depth or outlyingness of each observation.
Get metadata routing of this object.
get_params([deep])Get parameters for this estimator.
set_output(*[, transform])Set output container.
set_params(**params)Set the parameters of this estimator.
transform(X)Compute the depth or outlyingness inside the learned distribution.
- fit(X, y=None)[source]#
Learn the distribution from the observations.
- Parameters:
- Returns:
Fitted estimator.
- Return type:
- fit_transform(X, y=None)[source]#
Compute the depth or outlyingness of each observation.
This computation is done with respect to the whole dataset.
- get_metadata_routing()#
Get metadata routing of this object.
Please check User Guide on how the routing mechanism works.
- Returns:
routing – A
MetadataRequestencapsulating routing information.- Return type:
MetadataRequest
- get_params(deep=True)#
Get parameters for this estimator.
- set_output(*, transform=None)#
Set output container.
See Introducing the set_output API for an example on how to use the API.
- Parameters:
transform ({"default", "pandas", "polars"}, default=None) –
Configure output of transform and fit_transform.
”default”: Default output format of a transformer
”pandas”: DataFrame output
”polars”: Polars output
None: Transform configuration is unchanged
Added in version 1.4: “polars” option was added.
- Returns:
self – Estimator instance.
- Return type:
estimator instance
- set_params(**params)#
Set the parameters of this estimator.
The method works on simple estimators as well as on nested objects (such as
Pipeline). The latter have parameters of the form<component>__<parameter>so that it’s possible to update each component of a nested object.- Parameters:
**params (dict) – Estimator parameters.
- Returns:
self – Estimator instance.
- Return type:
estimator instance
Examples using skfda.exploratory.depth.IntegratedDepth#
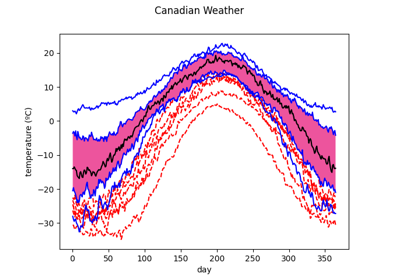
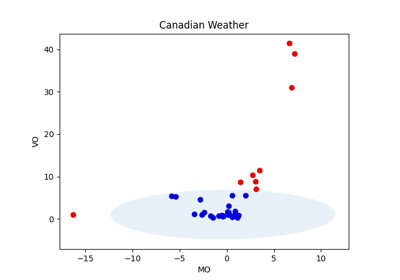
Meteorological data: data visualization, clustering, and functional PCA