Note
Go to the end to download the full example code. or to run this example in your browser via Binder
Discretized function representation#
Shows how to make a discretized representation of a function.
# Author: Carlos Ramos Carreño <vnmabus@gmail.com>
# License: MIT

# sphinx_gallery_thumbnail_number = 2

from skfda import FDataGrid

import numpy as np
We will construct a dataset containing several sinusoidal functions with random displacements.
random_state = np.random.RandomState(0)

grid_points = np.linspace(0, 1)
data = np.array([np.sin((grid_points + random_state.randn())
                        * 2 * np.pi) for _ in range(5)])
The FDataGrid class is used for datasets containing discretized functions that are measured at the same points.
fd = FDataGrid(data, grid_points,
               dataset_name='Sinusoidal curves',
               argument_names=['t'],
               coordinate_names=['x(t)'])

fd = fd[:5]
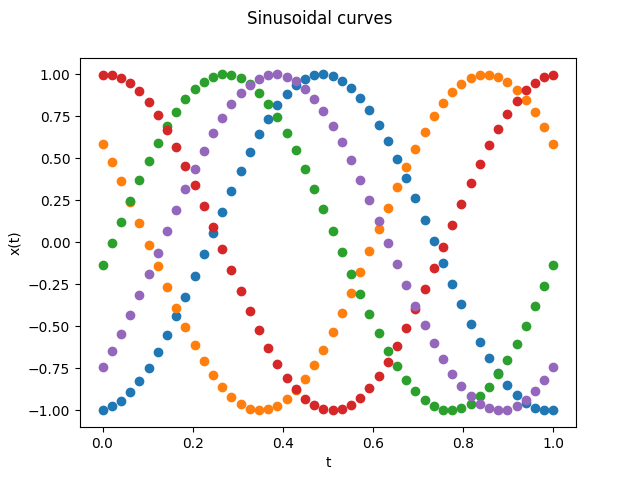
We can plot the measured values of each function in a scatter plot.
fd.scatter(s=0.5)
<Figure size 640x480 with 1 Axes>
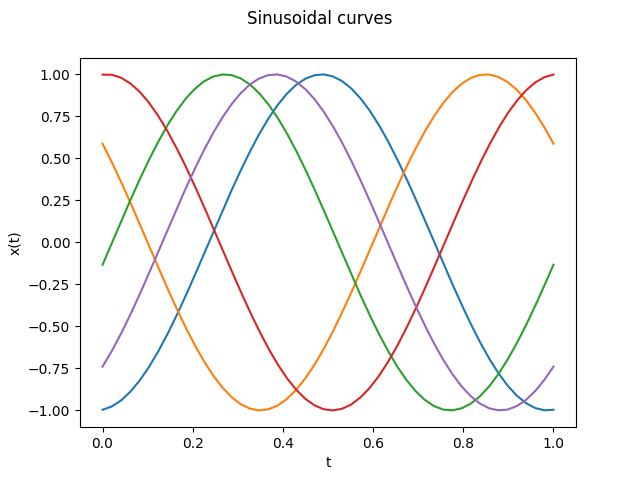
We can also plot the interpolated functions.
fd.plot()
<Figure size 640x480 with 1 Axes>
Total running time of the script: (0 minutes 0.121 seconds)